Understanding market trends and signals is crucial for any trader, especially newcomers. One of the key concepts to grasp is bullish and bearish divergence. While these terms might sound intimidating, they’re quite simple once broken down. This guide delves into bullish and bearish divergence, how to identify them, and what they indicate for your trading decisions.
What is Divergence?
Before delving into bullish and bearish divergence, let’s first understand what divergence means in the trading context. Divergence refers to a situation where the price of an asset and an indicator, such as the Relative Strength Index (RSI) or Moving Average Convergence Divergence (MACD), move in opposite directions. This disparity can signal potential shifts in market sentiment and provide valuable insights for traders.
What is Bullish and Bearish Divergence?
Before we dive into the details, let’s clarify what bullish and bearish divergence means. Both terms refer to discrepancies between price movements and related indicators, such as oscillators. These disparities can signal potential shifts in market direction.
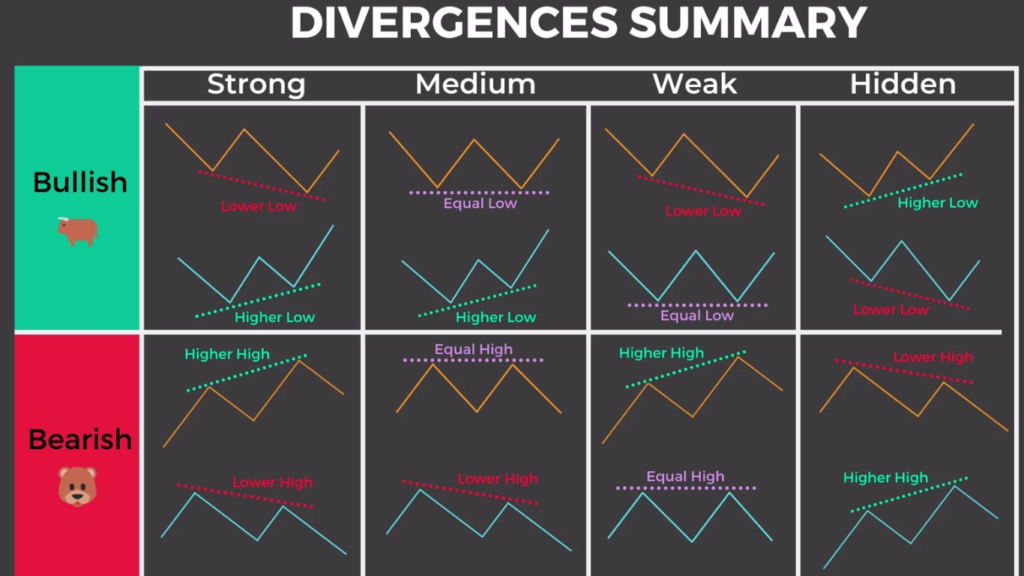
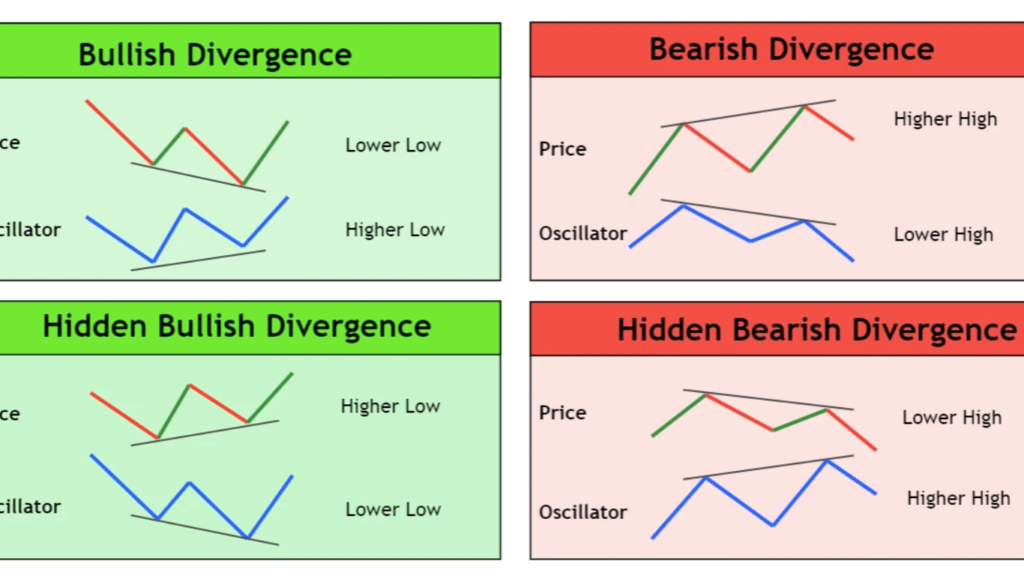
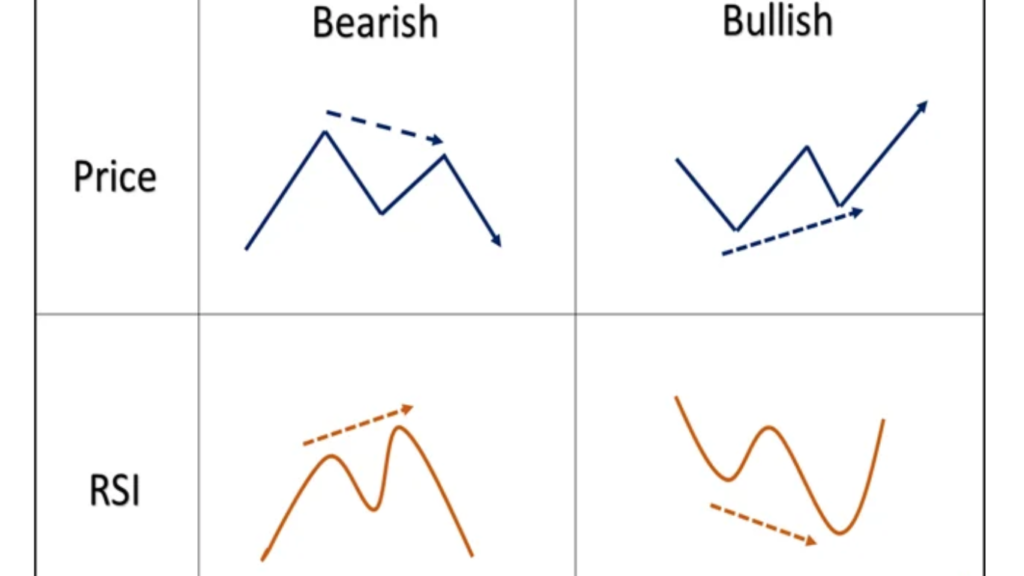
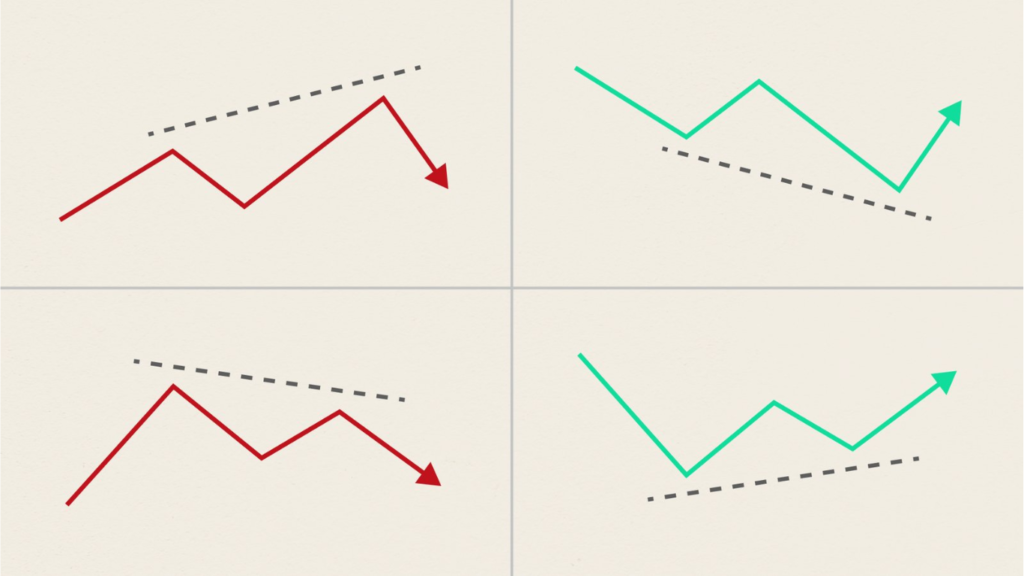
Bullish Divergence: Occurs when the price of an asset makes lower lows, while the indicator makes higher lows. This suggests that despite the downtrend in price, momentum is building upwards, indicating a possible reversal to the upside.
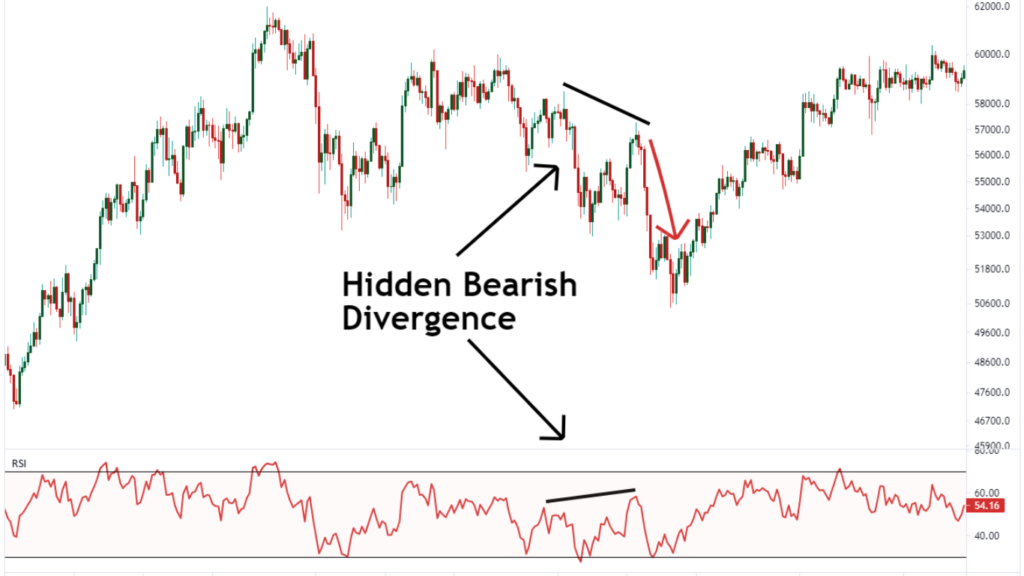
Bearish Divergence: Conversely, bearish divergence happens when the price forms higher highs, but the indicator forms lower highs. This indicates that while prices are climbing, momentum is weakening, signaling a potential reversal to the downside.
Identifying Bullish and Bearish Divergence
Now that we understand the basic definitions, let’s discuss how to spot these divergences on a price chart.
1. Price Trend Analysis: The first step is to analyze the trend of the asset’s price. Are prices making higher highs and higher lows (indicating an uptrend), or lower highs and lower lows (indicating a downtrend)?
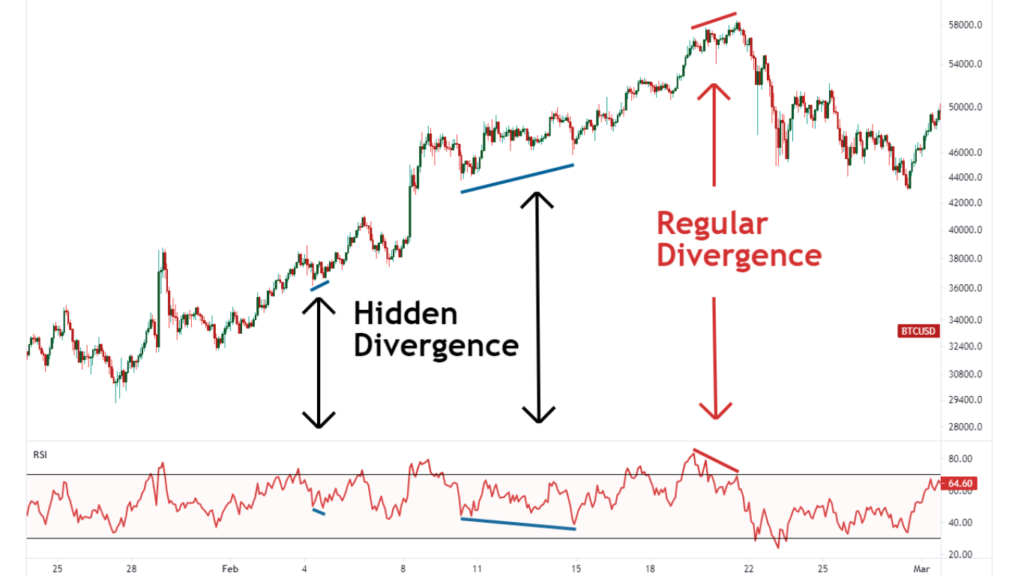
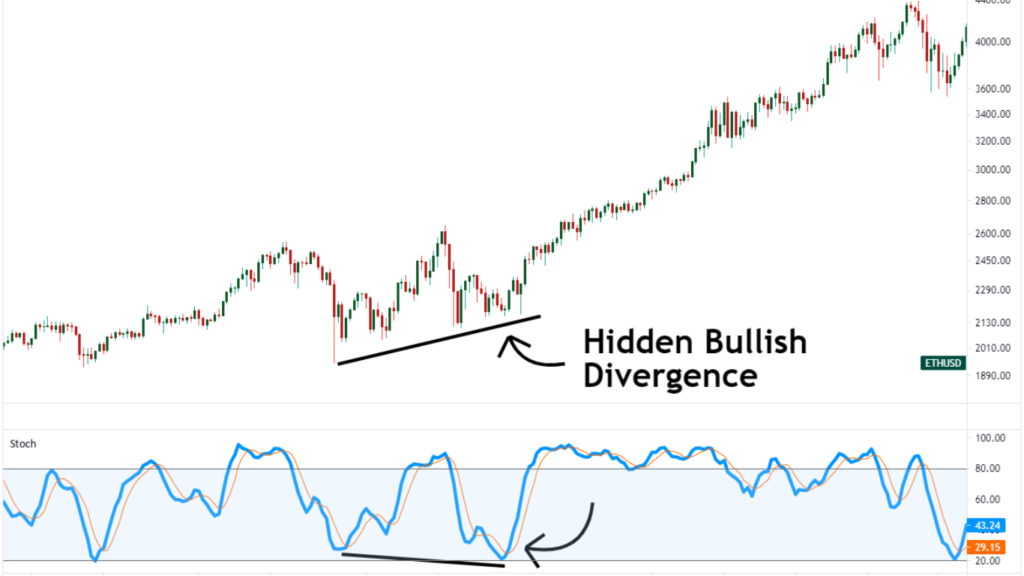
2. Indicator Confirmation: Look at the corresponding indicator, such as the Relative Strength Index (RSI) or the Moving Average Convergence Divergence (MACD). Compare the peaks and troughs of the indicator with those of the price.
3. Divergence Confirmation: If the price and the indicator are moving in opposite directions (i.e., the price is making lower lows while the indicator is making higher lows for bullish divergence, or the price is making higher highs while the indicator is making lower highs for bearish divergence), you’ve likely identified a divergence.
Example of Bullish and Bearish Divergence
Let’s walk through an example to illustrate these concepts.
Scenario: You’re analyzing the price chart of Company X’s stock over the past few months.Observation: You notice that the stock price has been steadily declining over this period, forming lower lows.
Indicator Analysis: Simultaneously, you look at the RSI indicator, which measures the momentum of the stock. Surprisingly, you see that the RSI is forming higher lows.
Interpretation: This discrepancy between the price and the RSI indicates a bullish divergence. Despite the downtrend in prices, momentum is building to the upside, suggesting that a reversal might be imminent.
On the flip side, a bearish divergence would occur if the stock price were making higher highs while the RSI was making lower highs, indicating weakening momentum despite rising prices.
Key Takeaways for New Traders
Now that we’ve covered the basics of bullish and bearish divergence, let’s summarize some key points for new traders to remember:
1. Confirmation is Key: Always look for confirmation from multiple indicators and other forms of analysis before making trading decisions based solely on divergence signals.
2.Use in Conjunction with Other Tools: Divergence signals are most effective when used in conjunction with other technical analysis tools, such as support and resistance levels or trendlines.
3.Practice and Patience: Like any trading strategy, mastering the identification and interpretation of divergences takes practice and patience. Don’t be discouraged by initial challenges; keep learning and refining your skills.
4. Risk Management: As with any trading strategy, risk management is crucial. Set stop-loss orders and adhere to them to minimize potential losses.
Conclusion
Bullish and bearish divergence might seem complex at first, but with practice and a solid understanding of the underlying concepts, they can become valuable tools in your trading arsenal. By recognizing these divergence signals and incorporating them into your analysis, you’ll be better equipped to make informed trading decisions and navigate the dynamic world of financial markets.
The information provided here is for general informational purposes only and should not be construed as financial advice. Investing in the stock market involves inherent risks, and there is no guarantee of profits or protection against losses. Before making any investment decisions, it is essential to conduct thorough research and seek advice from a qualified financial advisor or professional.
WhatsApp us
Register now for free stock market seminar this tuesday