Welcome to the attractive world of red candlestick secrets! If you’re new to trading or simply curious about technical analysis, you’ve come to the right place. In this beginner’s guide, we’ll delve into the mysteries of red candlesticks, what they signify, and how you can use them to your advantage in the trading world.
What are Red Candlesticks?
To kick things off, let’s start with the basics. Candlestick charts are a popular tool traders use to analyze price movements in financial markets. Each candlestick represents a specific period (such as a day, hour, or minute) and displays the opening, closing, high, and low prices for that period.
Now, when it comes to these candlesticks, the color red typically indicates a bearish market sentiment. In other words, it suggests that sellers have dominated the trading activity during that particular period, driving prices lower.
The Anatomy of a Red Candlestick
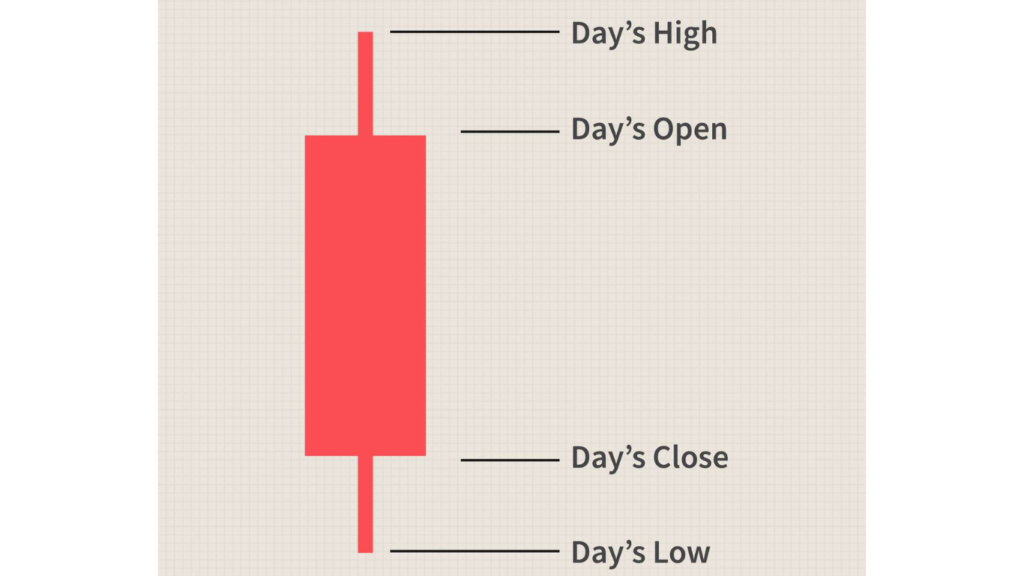
To better understand these candlesticks, let’s break down their anatomy:
Body: The main rectangular part of the candlestick represents the price range between the opening and closing prices. If the closing price is lower than the opening price, the body of the candlestick is filled or colored red.
Wicks: Also known as shadows or tails, these are the thin lines that extend above and below the body of the candlestick. They represent the highest and lowest prices reached during the period.
What Do Red Candlesticks Indicate?
These candlesticks provide valuable insights into market dynamics and investor sentiment. Here’s what they can tell you:
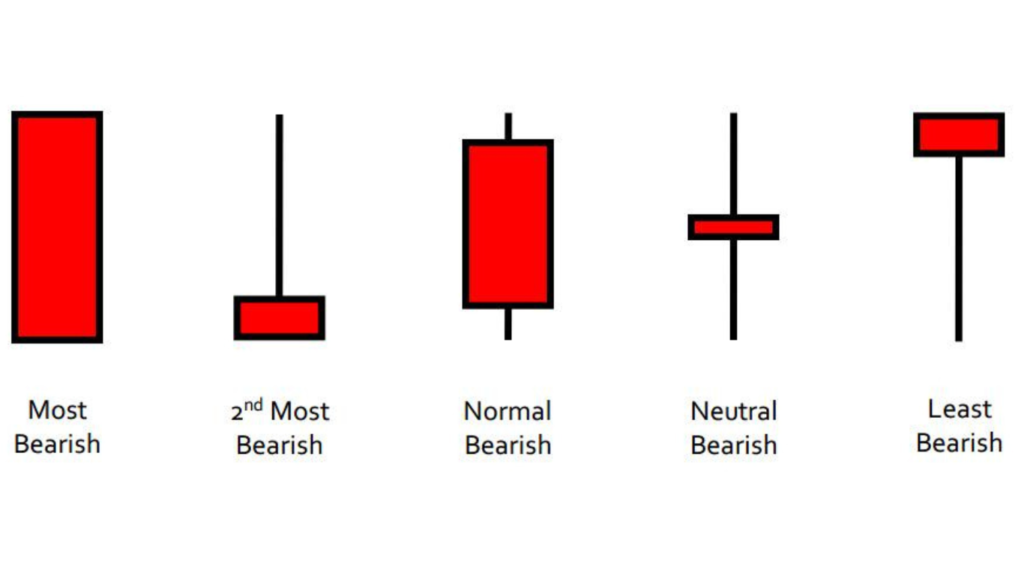
Bearish Pressure: The presence of these candlesticks suggests that sellers are exerting downward pressure on prices, indicating a potential downtrend in the market.
Weakness in Buying Interest: When you see a series of consecutive red candlesticks, it may indicate a lack of buying interest or conviction among investors.
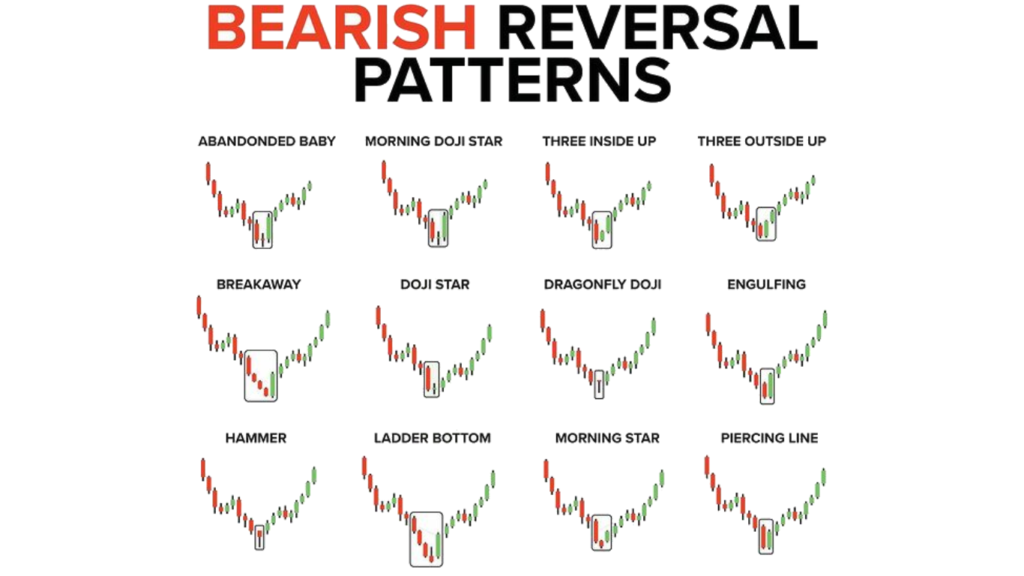
Potential Reversal Signals: In some cases, these candlesticks at the end of an uptrend could signal a potential reversal, especially when accompanied by other technical indicators or chart patterns.
How to Use Red Candlestick Patterns
Now that you understand what these candlesticks signify, let’s talk about how you can use this information in your trading strategy:
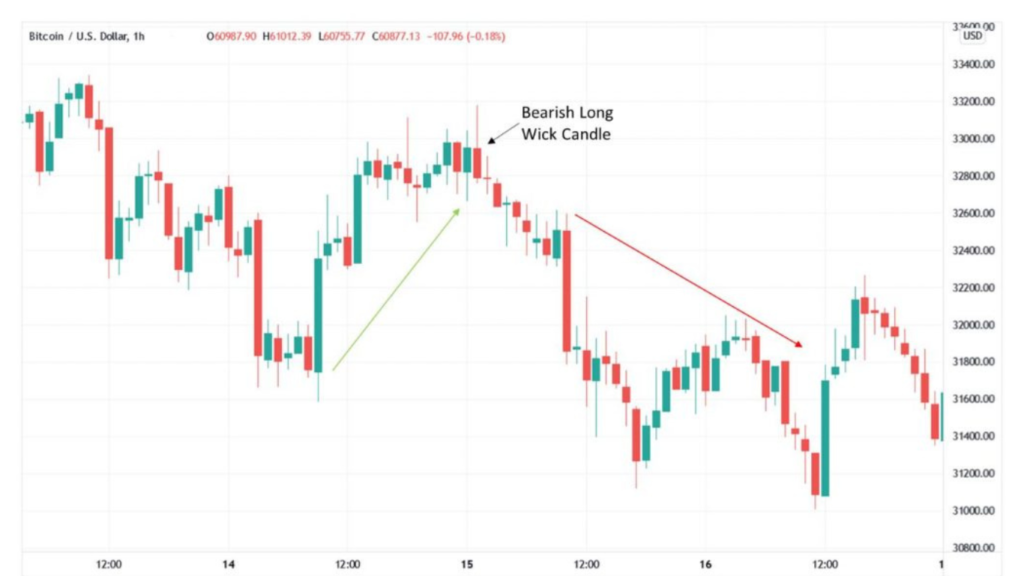
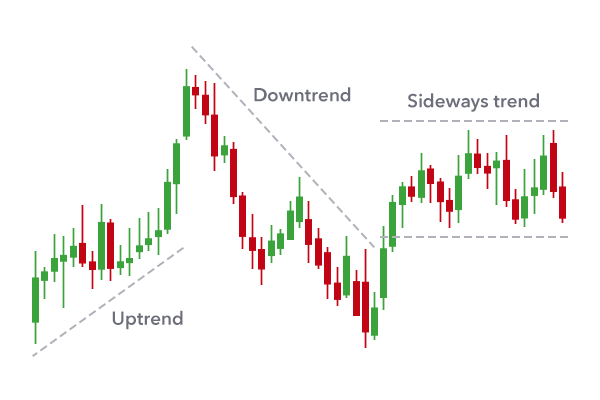
Identifying Trends: Look for clusters of these candlesticks to identify potential downtrends in the market. This can help you make informed decisions about selling or shorting assets.
Confirmation with Other Indicators: These candlesticks are most effective when used with other technical indicators, such as moving averages, RSI, or MACD, to confirm trend reversals or continuation patterns.
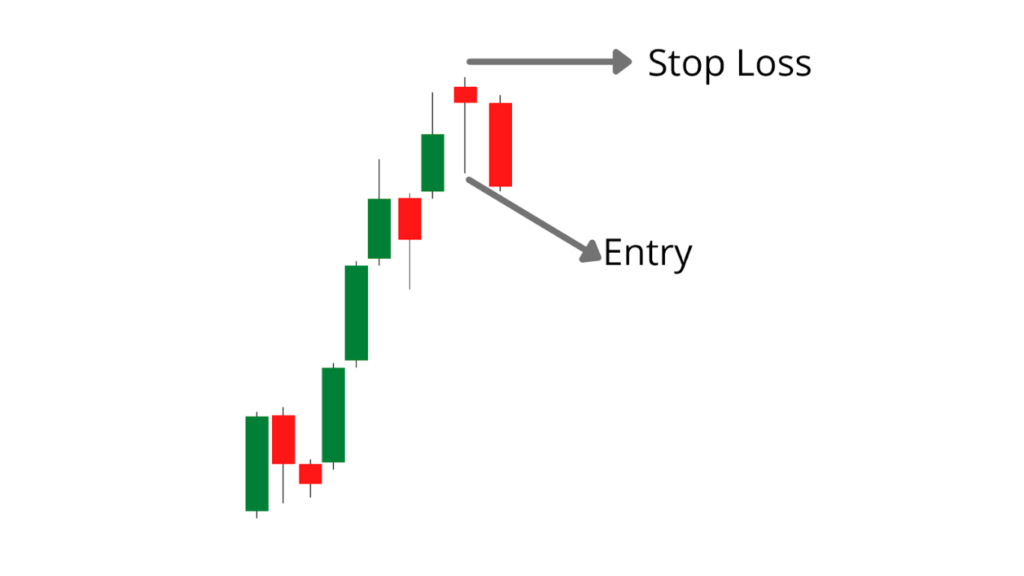
Setting Stop Losses: If you’re in a long position and notice a series of these candlesticks forming, consider setting tight stop losses to protect your capital in case the trend continues downward.
Conclusion
In conclusion, these candlesticks are crucial in technical analysis and can provide valuable insights into market sentiment and price movements. By understanding their significance and incorporating them into your trading strategy, you’ll be better equipped to navigate the complexities of the financial markets. So go ahead, dive into the world of these candlestick secrets, and unlock the potential for greater success in your trading endeavors!
The information provided here is for general informational purposes only and should not be construed as financial advice. Investing in the stock market involves inherent risks, and there is no guarantee of profits or protection against losses. Before making any investment decisions, it is essential to conduct thorough research and seek advice from a qualified financial advisor or professional.
WhatsApp us
Register now for free stock market seminar this tuesday