If you’ve just stepped into the world of trading and investing, you might have come across candlestick charts. At first glance, they can seem like a complex puzzle of lines and shapes. Fear not! In this beginner’s guide, we’ll demystify candlestick charts and break down the basics so you can confidently navigate the financial markets.
What are Candlestick Charts?
Candlestick charts are a visual representation of price movements in financial markets, such as stocks or cryptocurrencies. They display the open, closed, high, and low prices for a specific period. Each “candlestick” on the chart represents this price data in a way that is easy to interpret.
Anatomy of a Candlestick
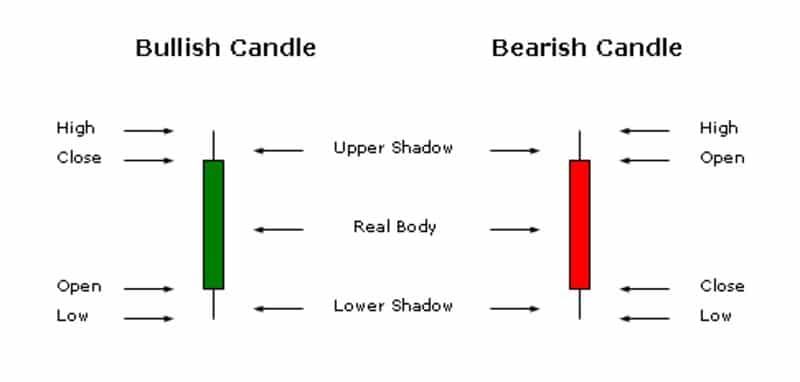
A single candlestick consists of a rectangular shape called the “body” and two lines extending from the top and bottom known as “wicks” or “shadows.” The body represents the price range between the opening and closing prices for a given period. If the closing price is higher than the opening price, the body is usually colored green or white, indicating a bullish (positive) movement. Conversely, if the closing price is lower than the opening price, the body is red or black, suggesting a bearish (negative) movement.
The wicks or shadows extend from the top and bottom of the body, showing the highest and lowest prices reached during that period. Understanding these elements helps traders make sense of market sentiment and potential trends.
Common Candlestick Patterns
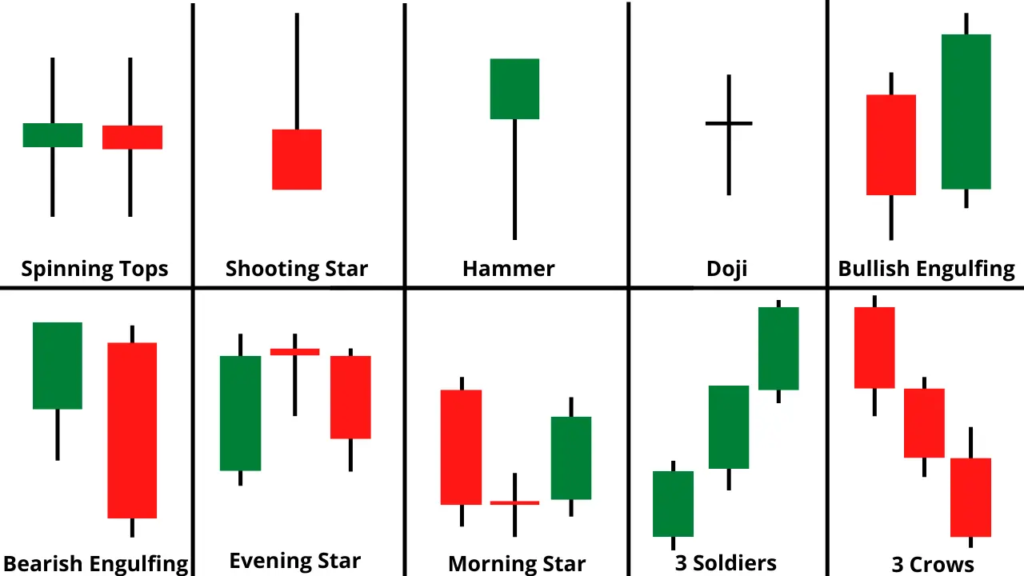
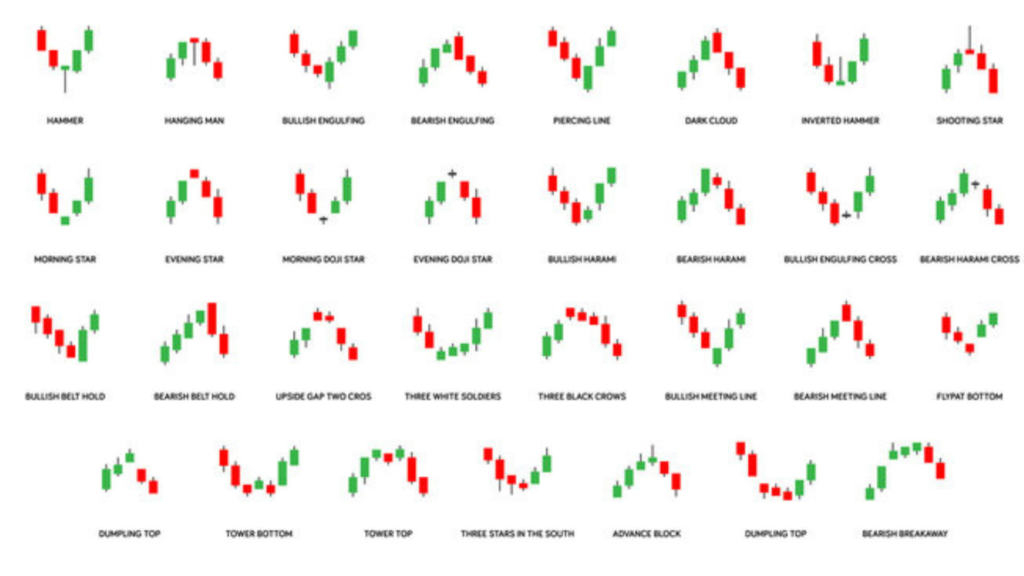
Candlestick charts are not just random shapes; they form specific patterns that traders use to predict future price movements. Here are a few common candlestick patterns:
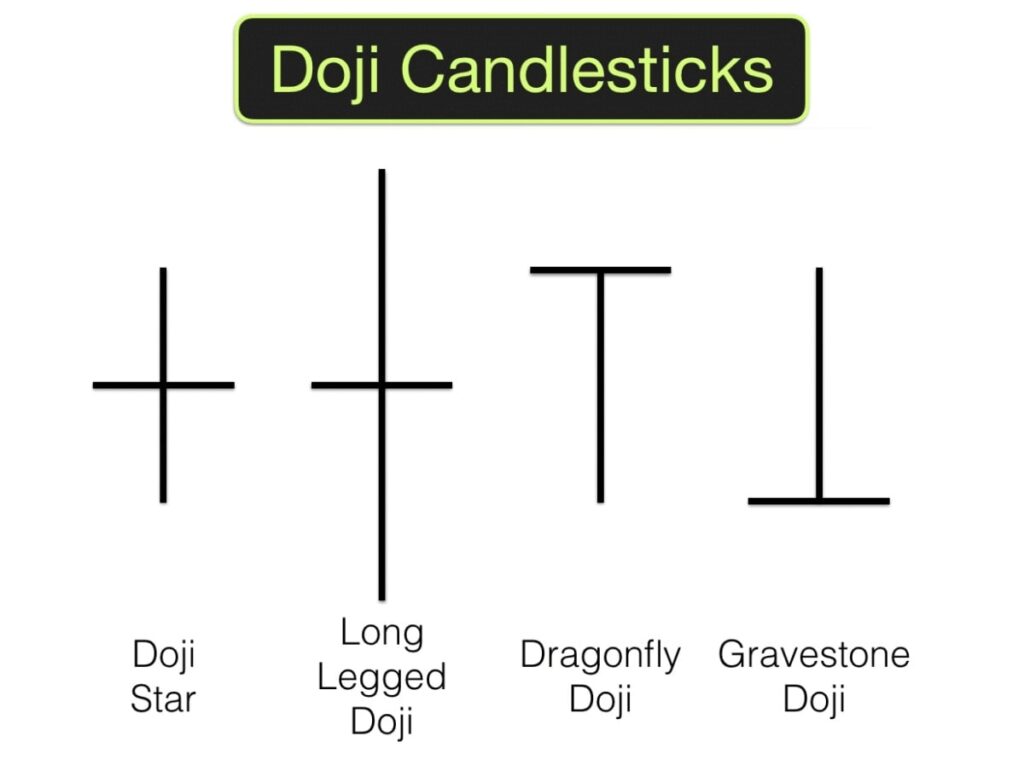
Doji: A doji has a small body, indicating that the opening and closing prices are very close or identical. This suggests market indecision and can signal a potential reversal.
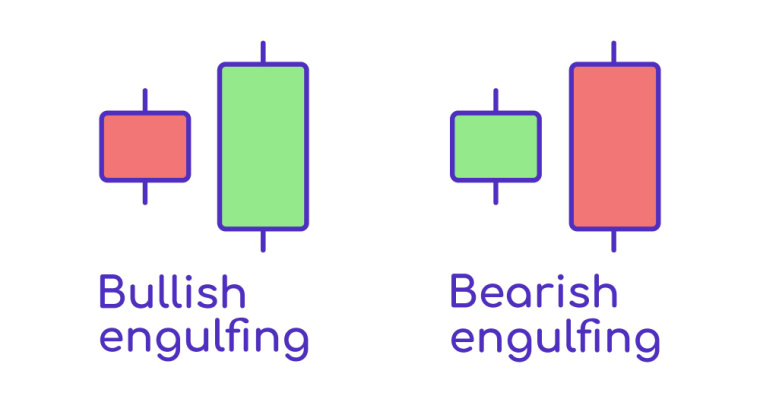
Engulfing Pattern: An engulfing pattern occurs when one candle completely engulfs the body of the previous candle. It often signifies a change in trend direction.
Hammer: A hammer has a small body with a long lower wick and little to no upper wick. This pattern suggests that sellers initially dominated, but buyers regained control, potentially signaling a reversal.
Morning Star: This bullish pattern consists of three candles – a bearish candle, a small doji or spinning top, and a bullish candle. It indicates a potential reversal from a downtrend to an uptrend.
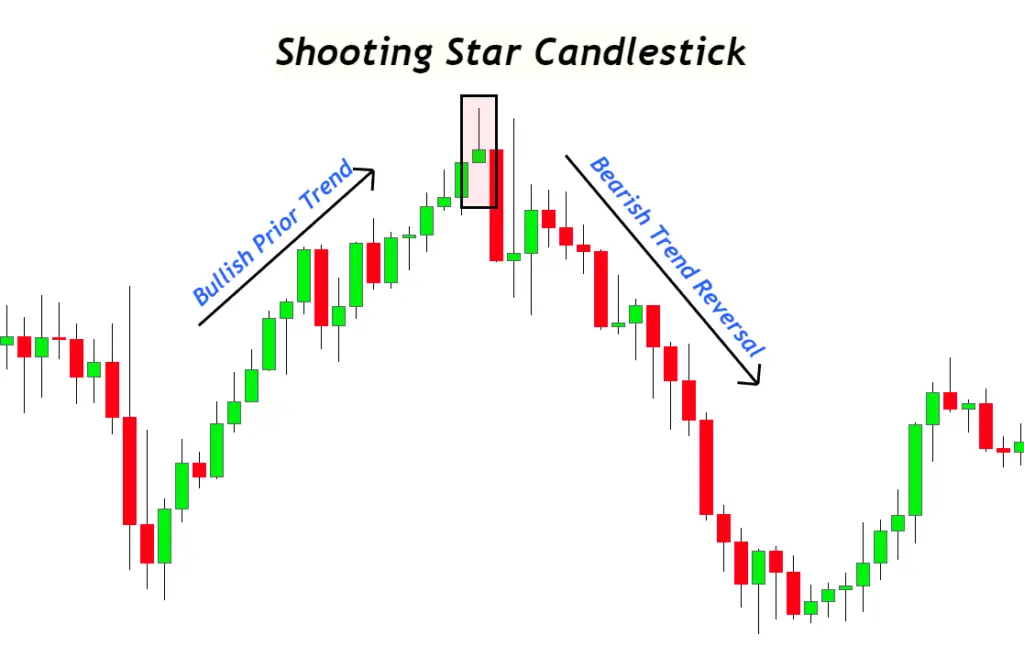
Shooting Star: The shooting star has a small body near the bottom of the candle and a long upper wick. It suggests buyers pushed the price higher during the session, but sellers took control by the end.
How to Read Candlestick Charts
Now that we’ve covered the basics, let’s discuss how to read candlestick charts:
Identify Trends: Look for consecutive bullish or bearish candlesticks to determine the prevailing trend. An uptrend consists of higher highs and higher lows, while a downtrend has lower highs and lower lows.
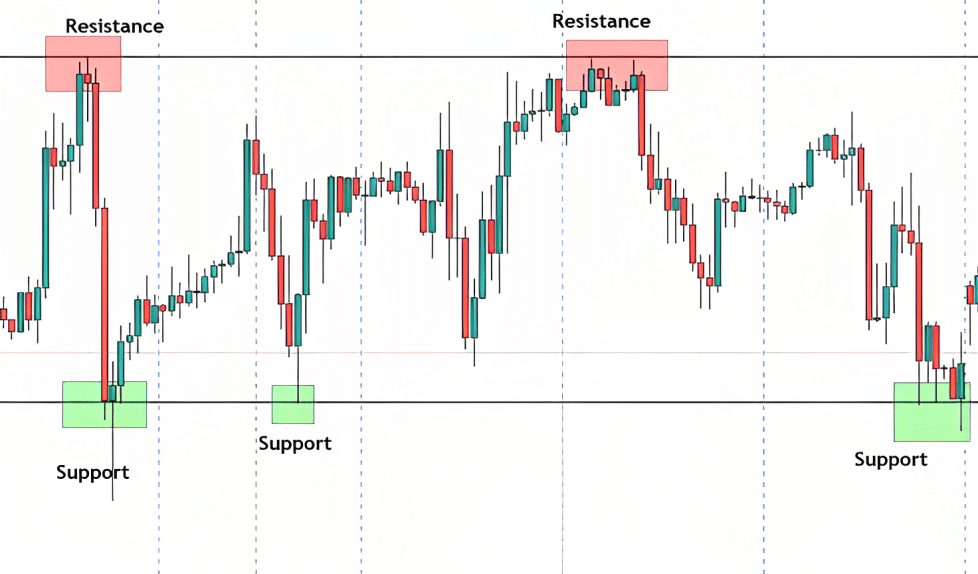
Understand Support and Resistance: The wicks of candlesticks often touch certain price levels, indicating areas of support or resistance. Support is where buying interest is significantly strong, preventing the price from falling further. Resistance is where selling interest prevents the price from rising.
Combined with Other Indicators:Candlestick charts are more powerful when used in conjunction with other technical indicators, such as moving averages or relative strength index (RSI), to confirm potential trends and reversals.
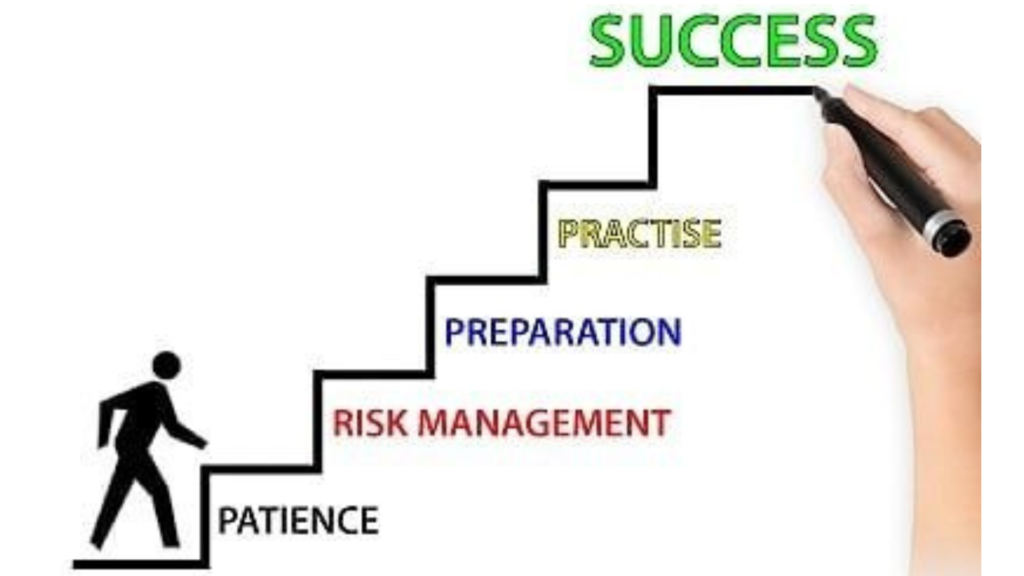
Practice Patience: Don’t make rushed decisions based solely on one or two candlesticks. It’s essential to consider the broader market context and use candlestick patterns as part of a comprehensive analysis.
Conclusion
Candlestick charts may initially appear intimidating, but with a bit of practice and understanding, they become valuable tools for traders. Remember, these charts provide insights into market sentiment, potential reversals, and trend continuations. As a beginner, take the time to learn and observe different patterns, and consider incorporating candlestick analysis into your overall trading strategy. With patience and a growing knowledge base, you’ll be better equipped to navigate the exciting world of financial markets. Happy trading!
The information provided here is for general informational purposes only and should not be construed as financial advice. Investing in the stock market involves inherent risks, and there is no guarantee of profits or protection against losses. Before making any investment decisions, it is essential to conduct thorough research and seek advice from a qualified financial advisor or professional.
WhatsApp us
Register now for free stock market seminar this tuesday