The OHLC Charts (Open, High, Low, Close) is a cornerstone in the field of technical analysis, providing traders with a comprehensive view of price movements over specific periods. This guide will delve deeply into the OHLC technique, exploring its significance, various chart formats, and its application in different trading strategies. We will also discuss how to identify market trends, understand market volatility, and incorporate other technical indicators into your trading strategy.
Understanding the OHLC Technique
Explanation of OHLC
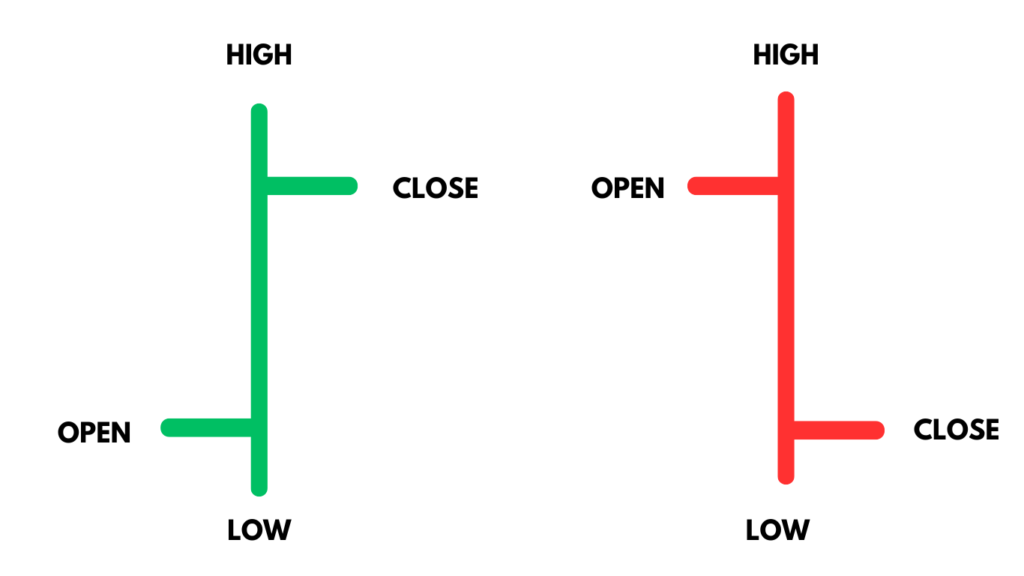
- Open: The price at which a security begins trading when the market opens. This initial price sets the stage for the trading session.
- High: The highest price achieved during the trading period. It shows the maximum buying pressure.
- Low: The lowest price during the trading period. It indicates the maximum selling pressure.
- Close: The final price at which the security trades at the end of the trading period. This is often considered the most significant price as it reflects the final consensus of the market for that period.
Importance of OHLC Data
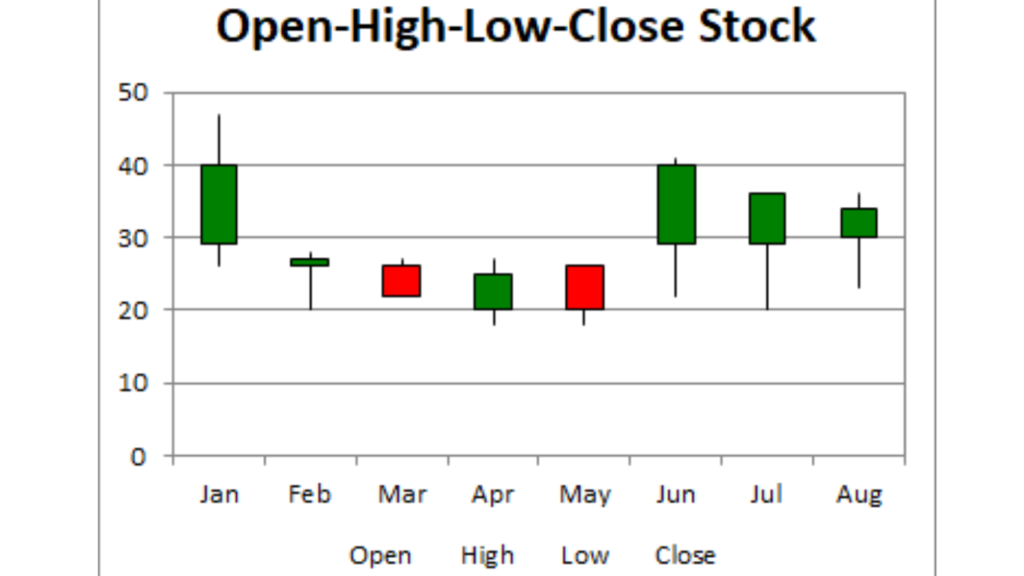
OHLC data is crucial because it provides a complete picture of price action over a specified period. This data helps traders and analysts in several ways:
- Trend Identification: By observing the high and low prices sequence, traders can determine the market’s direction.

- Volatility Assessment: The difference between the high and low prices indicates the level of volatility during the trading period.
- Market Sentiment Analysis: The relationship between open and close prices provides insight into market sentiment—whether bullish or bearish.
Significance of Candlestick and Bar Chart Formats
Candlestick Charts
Candlestick charts are a visual representation of OHLC data that originated in Japan. They use candlesticks to show the open, high, low, and close prices for a specified period. Each candlestick consists of a body and wicks (shadows).
- Body: The difference between the open and closed prices.
- Bullish Candlestick: The body is typically green or white if the close price is higher than the open price.
- Bearish Candlestick: If the close price is lower than the open price, the body is usually red or black.
- Wicks (Shadows): The lines extending from the body that show the high and low prices.
Bar Charts
Bar charts also display OHLC data but in a different format. Each bar represents a single trading period.
- Vertical Line: Shows the range between the high and low prices.
- Horizontal Tick on the Left: Indicates the opening price.
- Horizontal Tick on the Right: Indicates the closing price.
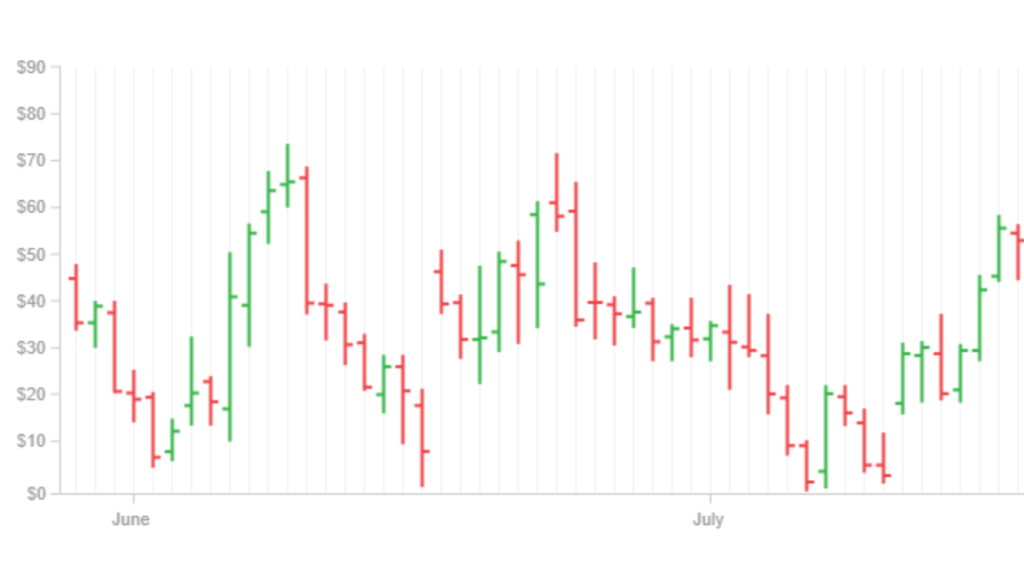
Both candlesticks and bar charts are essential tools in technical analysis, providing detailed insights into price movements.
Understanding Chart Timeframes
Chart timeframes are critical in technical analysis and vary based on trading styles:
- Intraday Trading: Utilizes short-term charts like 1-minute, 5-minute, or hourly charts to make quick trading decisions within the same day.
- Swing Trading: Uses daily or weekly charts to hold positions for several days or weeks, capitalizing on medium-term price movements.
- Long-Term Investing: Focuses on monthly or yearly charts to make decisions based on long-term trends and market fundamentals.

Analyzing Price Movements and Trends
Identifying Market Trends
Identifying trends is fundamental in trading. Trends can be:
- Uptrend (Bullish): A series of higher highs and higher lows.
- Downtrend (Bearish): A series of lower highs and lower lows.
- Sideways (Neutral): Price moves within a range without a clear direction.
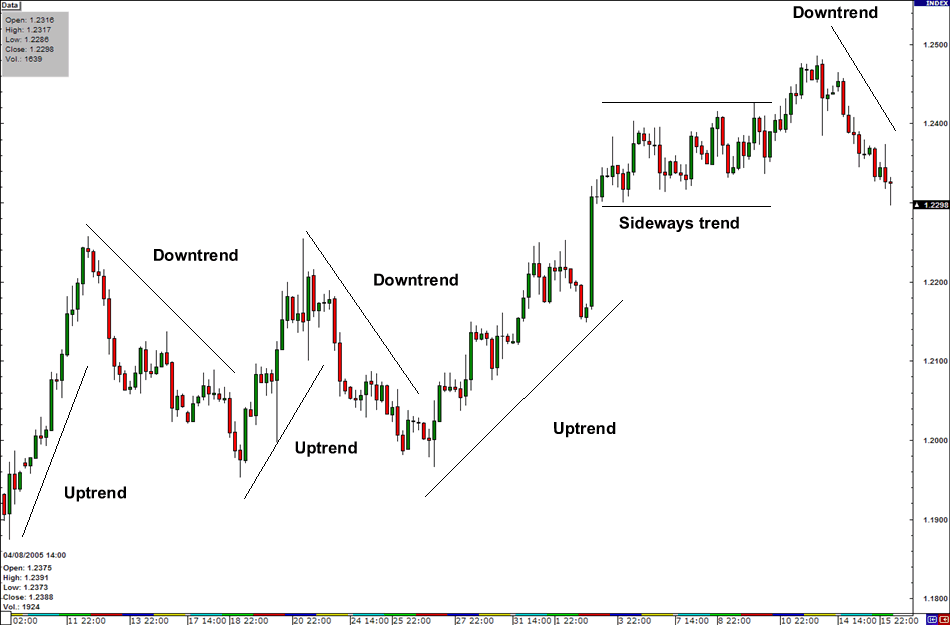
Traders use various tools to identify trends:
- Trend Lines: Drawn by connecting significant highs or lows. They help visualize the direction of the trend.
- Moving Averages: Averages of past prices over a specific period, smoothing out price data to reveal trends. Common types include Simple Moving Average (SMA) and Exponential Moving Average (EMA).
Price Pattern Detection
Price patterns are formations created by the movement of prices and are used to predict future movements. Common patterns include:
- Head and Shoulders: Indicates a reversal from an uptrend to a downtrend. It consists of a peak (head) between two smaller peaks (shoulders).
- Double Top and Double Bottom: Signal potential reversals. A double top occurs at the end of an uptrend, and a double bottom occurs at the end of a downtrend.
- Triangles (Ascending, Descending, and Symmetrical): Represent periods of consolidation before a breakout.
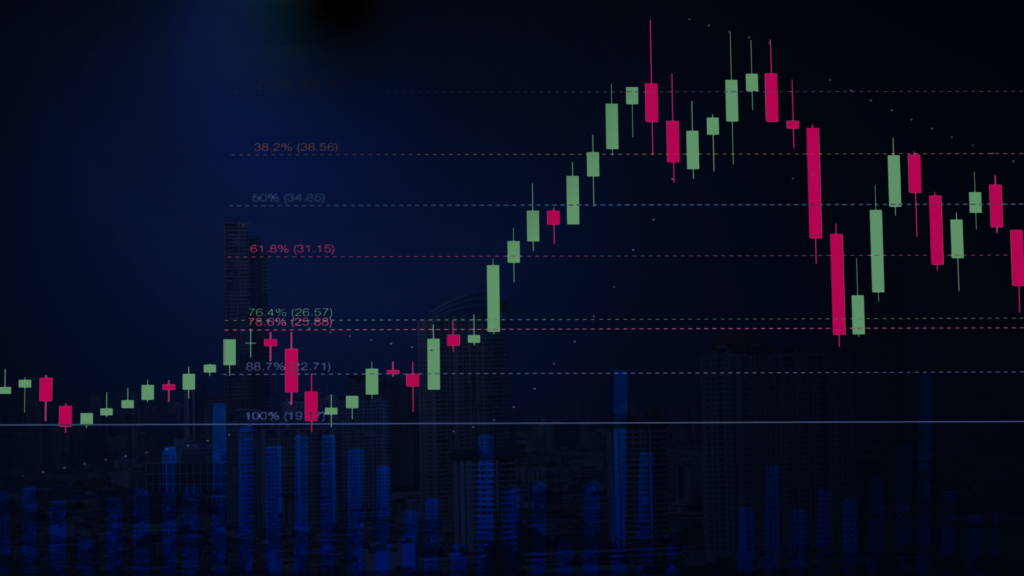
Technical Indicator Components
Key Technical Indicators
- Moving Averages: Help smooth out price action and identify trends.
- Simple Moving Average (SMA): The average of a security’s price over a specified number of periods.
- Exponential Moving Average (EMA): Gives more weight to recent prices, making it more responsive to new information.
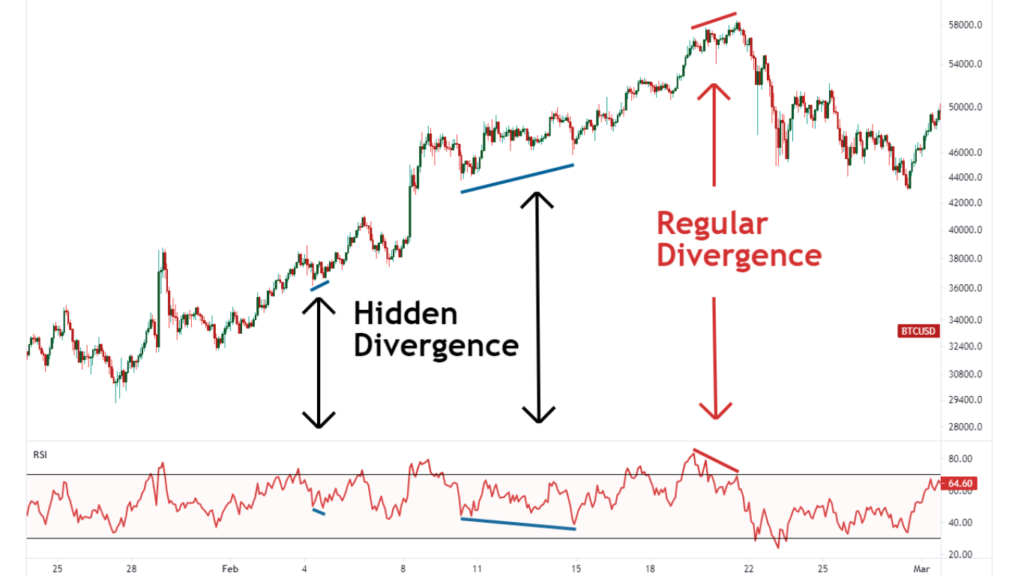
- Relative Strength Index (RSI): Measures the speed and change of price movements to identify overbought or oversold conditions.
- MACD (Moving Average Convergence Divergence): Shows the relationship between two moving averages of prices and helps identify trend changes.
OHLC Charts in Modern Trading Strategies
Intraday Trading
Intraday trading involves making multiple trades within the same day, focusing on short-term price movements.
- Scalping: A strategy that aims to profit from small price changes. Scalpers make numerous trades throughout the day, relying on OHLC charts and technical indicators for precise entry and exit points.
- Momentum Trading: Traders seek stocks that are moving significantly in one direction on high volume. OHLC charts help identify these momentum plays.

Swing Trading
Swing trading involves holding positions for several days or weeks. Swing traders use daily or weekly OHLC charts to identify and capitalize on short- to medium-term price movements.
Long-Term Investing
Long-term investors hold positions for months or years. They use monthly or yearly OHLC charts to make decisions based on broader market trends and fundamental analysis.

Understanding Market Volatility
Market volatility refers to the degree of variation in the price of a security over time. High volatility means significant price fluctuations, which can present both opportunities and risks. OHLC charts help traders understand and manage volatility by providing detailed price data.
Role of Market Fundamentals
While technical analysis focuses on price movements, market fundamentals also play a crucial role in trading decisions. Fundamentals include economic indicators, earnings reports, and geopolitical events. Combining OHLC data with fundamental analysis provides a more comprehensive view of the market.

Other Chart Types Used in Technical Analysis
Line Chart
Line charts plot closing prices over a period, providing a simplified view of price movements. They are easy to read but lack the detailed information of OHLC charts.
Point and Figure Chart
Point and figure charts focus on price movements without considering time. They highlight significant price changes and ignore minor fluctuations.

Candlestick Chart
Candlestick charts provide detailed OHLC information in an easy-to-read format, highlighting market sentiment and trends. They are widely used due to their visual appeal and detailed insights.
Comparison with OHLC Charts
While each chart type has its advantages, OHLC charts are particularly valued for their detailed and comprehensive information, making them a staple in technical analysis.
Key Trading Strategies and Concepts
Scalping
Scalping involves making numerous trades to capture small price movements. Scalpers rely heavily on OHLC charts and technical indicators to time their trades precisely.
Day Trading
Day traders buy and sell securities within the same trading day. OHLC charts help them identify intraday trends and make quick decisions.

Technical Analysis
Technical analysis uses historical price data to predict future price movements. OHLC charts are foundational to this approach, providing the data needed for various analyses.
Momentum Trading
Momentum traders seek to capitalize on strong price movements. They use OHLC charts to identify stocks with significant momentum.
Price Action
Price action trading focuses on the movement of prices rather than indicators. OHLC charts are essential for analyzing price action.

Volume Analysis
Volume analysis examines the quantity of securities traded. OHLC charts with volume overlays help traders understand the strength of price movements.
Chart Patterns
Chart patterns like head and shoulders, triangles, and double tops/bottoms are used to predict future price movements. OHLC charts are critical for identifying these patterns.

Support and Resistance
Support and resistance levels indicate where prices are likely to stop and reverse. OHLC charts help identify these crucial levels.
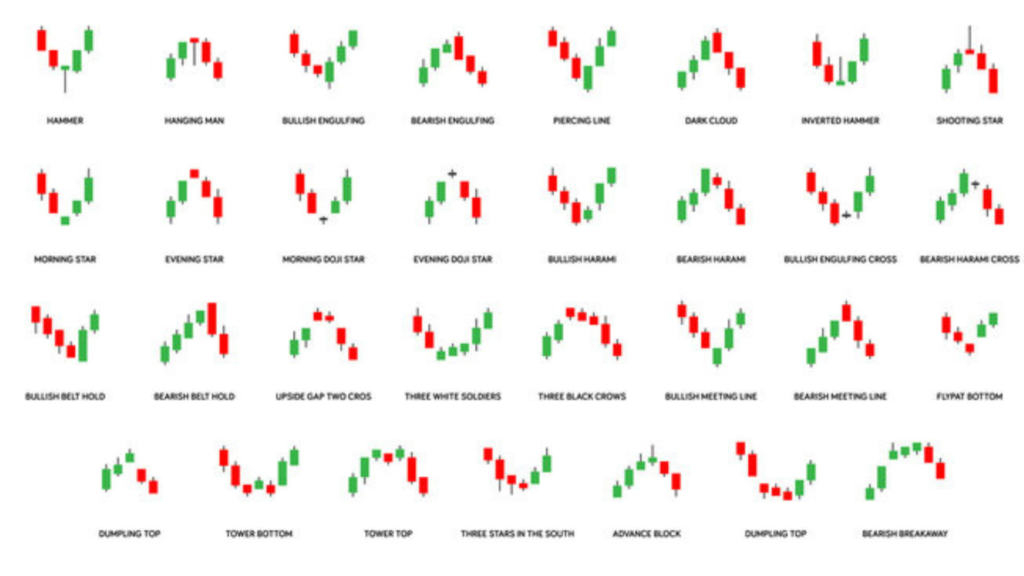
Candlestick Patterns
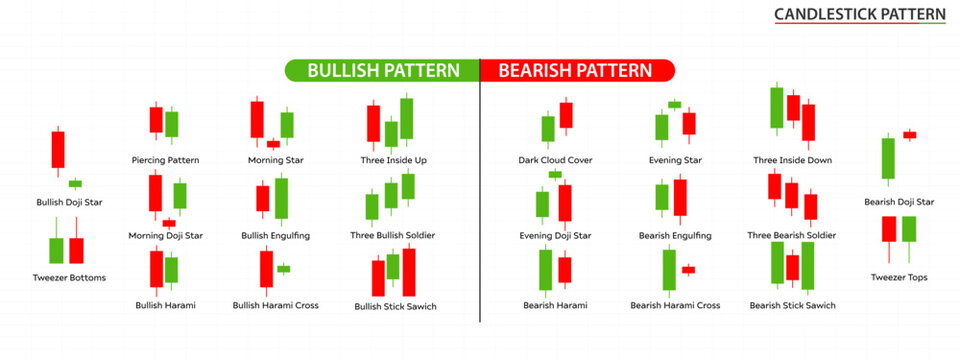
Candlestick patterns like doji, engulfing, and hammer provide insights into market sentiment. OHLC charts are used to spot these patterns.
Trend Lines
Trend lines connect significant price points, helping traders identify the direction of the market. OHLC charts provide the data needed to draw accurate trend lines.
Moving Averages
Moving averages smooth out price data, revealing trends. OHLC charts provide the raw data for calculating moving averages.

Open high-low scanners
Open high-low scanners help traders identify stocks that open at the high or low of the day, providing potential trading opportunities based on OHLC data.

Trading Rules
Entry Rules
- Scalping: Enter when the price breaks a significant level with high volume.
- Day Trading: Enter when technical indicators and OHLC patterns align.
Exit Rules
- Scalping: Exit quickly to lock in small profits.
- Day Trading: Exit when the price hits predefined targets or shows reversal signs.

Risk Management
Risk management is crucial in trading. Techniques include:
- Stop Loss: Setting a predefined level to exit a losing trade. This helps limit potential losses.
- Position Sizing: Determining the amount to trade based on risk tolerance. This ensures that no single trade can significantly impact the trader’s overall portfolio.

Conclusion
The OHLC technique is indispensable in modern trading, providing detailed insights into price movements and trends. By understanding and applying OHLC charts, traders can enhance their decision-making and develop effective strategies. Whether you’re involved in scalping, day trading, or long-term investing, integrating OHLC analysis with other technical and fundamental tools will improve your trading performance. Remember, Millionaires Group is here to guide you through your trading journey.
By leveraging the OHLC technique and combining it with a robust understanding of technical analysis, traders can navigate the complexities of the market with greater confidence and precision.
FOR A FREE STOCK MARKET SEMINAR VISIT HERE
CALLS @ 9986622277
Disclaimer
The information provided here is for general informational purposes only and should not be construed as financial advice. Investing in the stock market involves inherent risks, and there is no guarantee of profits or protection against losses. Before making any investment decisions, it is essential to conduct thorough research and seek advice from a qualified financial advisor or professional.
