When you first start learning about stock trading, it can feel like you’re entering a world filled with jargon and complex terms. But don’t worry! Like any new skill, stock trading can become easier as you familiarize yourself with the language. Understanding these common stock trading terms can be the first step toward becoming a confident trader. In this blog, we will break down the most important stock trading terms that every aspiring trader should know.

Top Stock Trading Terms
1. Stock
Stock is a portion of a company’s ownership. When one buys stock, he essentially owns some part of that company. Stocks get traded on the stock exchange, which includes NSE India (National Stock Exchange of India).
2. Stock Exchange
The stock exchange is a marketplace for trading in stocks. In India, there are two big stock exchanges—NSE (National Stock Exchange of India) and BSE, standing for Bombay Stock Exchange.
3. Nifty
Nifty, otherwise known as Nifty 50, is the benchmark index of NSE India. It comes from the performances of the 50 largest and most liquid stocks listed on the NSE. It reflects the market performance in India and is generally considered a popular indicator.
4. Bank Nifty
Bank Nifty is used to denote the banking sector-based index of the most liquid and large-capitalized banking stocks listed on NSE India. This includes major Indian banks and is taken to be an indicator of the performance of the banking sector of the country.

5. Index
It is a measure of the performance of the group of stocks. For example, Nifty 50 and Bank Nifty capture the trend of markets and help investors explain the market movements.
6. Index trading
It is trading of Nifty 50 or Bank Nifty rather than a deal in individual stocks. This makes the stand taken by the investor easier on some particular sector or the performance of the market as a whole.
7. NSE India
NSE India happens to be one of the largest stock exchanges in India. The company hosts a platform for trading in equities, bonds, and other financial instruments. NSE India has been characterized by an electronic trading system that offers a lot of transparency and efficiency.
8. Day Trading
Day trading: Buy and sell a lot of stocks within one trading day. This allows day traders to make quick profits off small price movements. It is a risky move that requires a person to be well conversant with the market trends and trading techniques.

9. Bull Market
During the period when the stock prices are going up, the investor feels optimistic and confident, hence buying more stocks.
10. Bear Market
A bear market is the opposite of a bull market. It is when stock prices are trending down, and the investor sentiment is negative.
11. Blue-Chip Stocks
The term refers to the shares of established companies with a history of reliable performance. Normally, they include industry leaders who maintain a stable financial position.
12. Market Capitalization
Market capitalization, or simply market cap, is the value of outstanding shares in a company. It is calculated by multiplying the current share price by the total number of outstanding shares. This information helps investors learn about a company’s size.

13. Dividend
A dividend refers to a part or portion of the earnings of a firm that is given to shareholders. Companies distribute dividends as a way of sharing their profits with the investors.
14. IPO (Initial Public Offering)
An IPO is when a company issues shares to the public for the first time. It allows firms to generate capital by issuing shares to various investors.
15. Bid and Asking Price:
The bid price is the highest amount of money the buyer is willing to pay for a particular stock, and the asking price is the lowest price for which a seller for the same stock is ready to sell it. Spread is the difference between the bid and asked price.
16. Volume
Volume describes the quantity or number of shares traded in a given period. If volume is high, then there is strong interest in a given stock; otherwise, if it is low, the interest will be less.

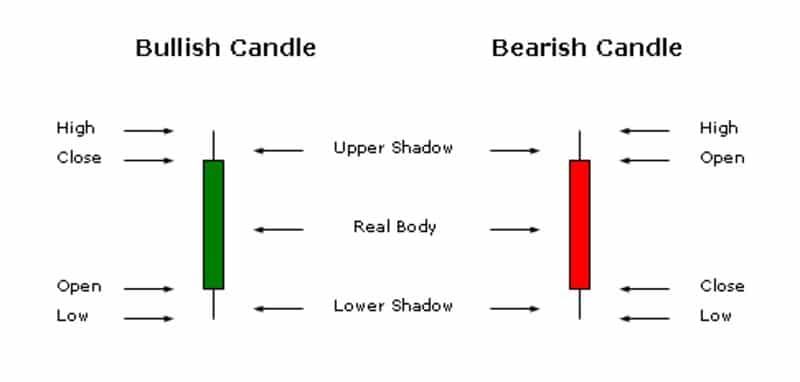
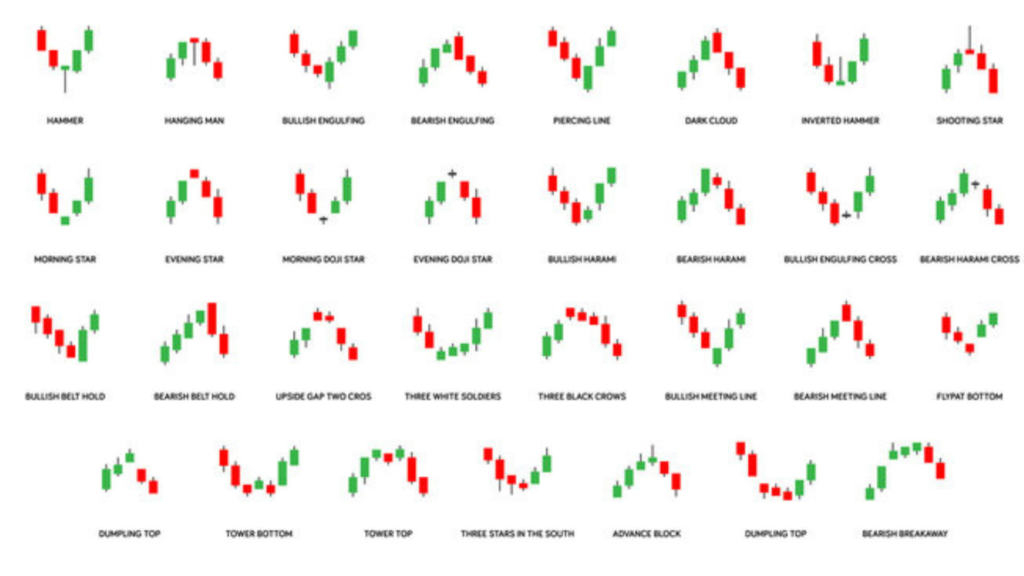
Candlestick patterns are visual representations showing price movements in a stock chart. Each of these sticks shows the open, closed, high, and low prices for a specific period. Among common candlestick formations, there exist doji, hammer, and engulfing patterns that foretell future price movements.
18. Support and Resistance
Support is a level of price at which the stock finds buying interest, that stops it from going down any further. Resistance is such a price level where selling pressure becomes significant to stop the stock from going higher.
19. Trend
A trend describes the general direction the price of a stock is moving in. It can be upward, downward, or sideways.
20. Moving Averages
The moving average smooths price data by creating a constantly updated average price. Common types include the simple moving average and exponential moving average. They help in pointing out trends and possible reversal points.

21. RSI—Relative Strength Index
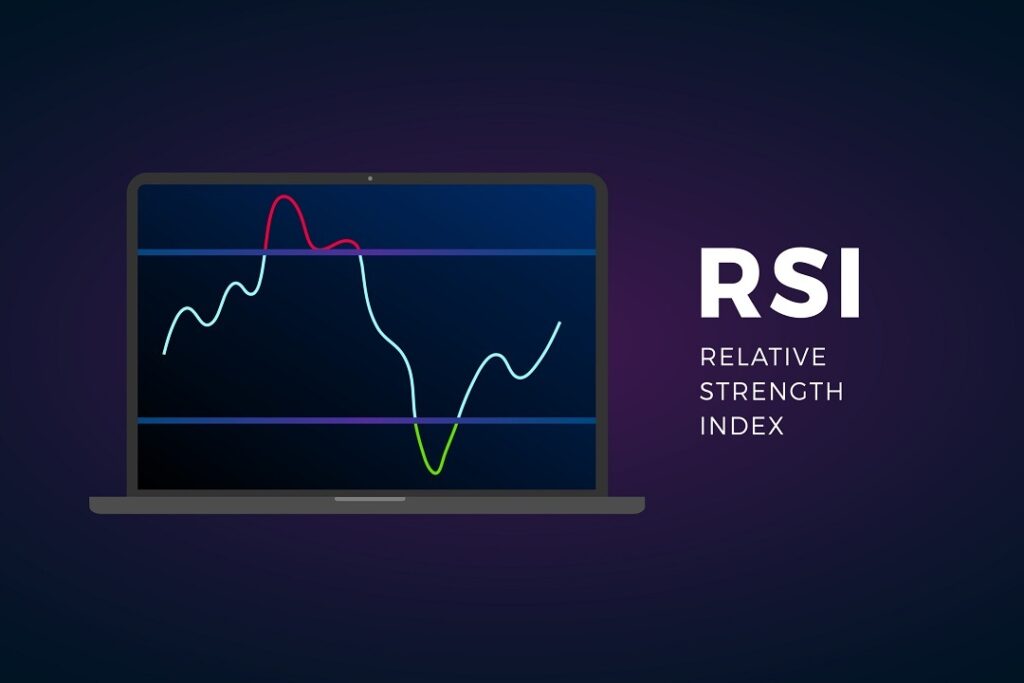
The RSI is an indicator of momentum; it measures the velocity or change in price movements. It is used to determine overbought or oversold conditions of a security.
22. MACD—Moving Average Convergence Divergence
MACD is a trend-following momentum indicator that indicates the relationship between two moving averages of the price of a security. It’s used to identify possible buy and sell signals.
23. Leverage
Leverage refers to using borrowed funds to get a better return on your investment. No doubt, leverage can increase your profits, but it will increase the potential loss as well.
24. Margin
Margin means money lent by a broker to purchase securities. It enables traders to acquire more stock than their own money can buy, increasing risk along the way.

25. Stop Loss
A stop loss is a sell order on security upon reaching a given price. It is mainly used to prevent the loss of money when the price of a stock moves against the expectations of the trader.
26. Take Profit A take-profit order is set to sell a security upon the attainment of a certain level of profit. This is used in locking in gains, ensuring the realization of profits.
27. Swing Trading
Swing trading is an investment strategy where one holds onto stocks for some days to weeks to gain from short-term price movements. The swing trader relies on technical analysis to spot potential trades.
28. Fundamental Analysis
Fundamental analysis involves looking at the company’s general financial health, considering earnings, revenues, and growth potential. This helps the investor know the intrinsic value of a stock.

29. Technical Analysis
Technical analysis is conducted to project future price movements from the study of the history of price and volume conditions. Charts and indicators are used by traders to look for trends and trading opportunities.
30. Earnings Per Share (EPS)
It is obtained by dividing the net earnings of a company by the number of its outstanding shares. It represents the profitability of the firm on a per-share basis.
31. P/E Ratio (Price-to-Earnings Ratio)
This enables the investor to find out the current share price about its earnings per share. The ratio is used to identify whether a stock is undervalued or overvalued.
32. Dividend Yield
It is the ratio of annual dividend payments to the current price of the stock. It measures the amount of income one might expect to earn from dividends.

33. Market Order
The market order is the buying or selling of a particular stock at its prevailing current market price. It gets executed immediately; however, due to the fluctuation of the market, the exact price may not be guaranteed.
34. Limit Order A limit order is an instruction to buy or sell some stock at a certain price or better. This ensures that the order is executed at the desired price, but may not get filled if the market doesn’t reach that price.
35. Short Selling Short selling is when a trader sells the borrowed security and expects a fall in the price of that very security. Thus, he buys back the shares at the reduced price to return to the lender and pockets the difference.
36. Long Position When a trader buys the stock on the assumption that the price will go up, he has taken a long position. He will profit from selling the stock at a higher price.

37. Volatility
Volatility is the degree of variation of a security’s price over time. High volatility means a wide fluctuation in the security’s price; low means that prices are more stable.
38. Portfolio
A portfolio is a group of investments owned by an individual or organization. Diversifying the portfolio means that the risk is spread through various assets.
39. ETF — Exchange-Traded Fund
An ETF is an investment fund trading on stock exchanges, just like any other stock, holding within it a basket of securities, bonds, commodities, or other assets, offering diversification.
40. Mutual Fund
A mutual fund pools money from multiple investors to invest in a diversified portfolio of assets. The fund is managed by professional fund managers and offers a convenient route for investing in various securities.

Conclusion
In conclusion, understanding the essential stock trading terms is crucial for anyone looking to navigate the complex world of trading successfully. Familiarity with these basic trading terms can empower you to make informed decisions and engage confidently in discussions about market trends and strategies. Whether you’re a novice or an experienced trader, mastering these trading terms will enhance your trading skills and help you stay ahead in the competitive stock market. Remember, knowledge is key in stock trading, and being well-versed in these fundamental concepts can lead to more successful investment outcomes.
By continuously learning and applying these concepts, you can navigate the stock market with confidence. Happy trading!
FOR A FREE STOCK MARKET SEMINAR VISIT HERE
CALLS @ 9986622277
Disclaimer
The information provided here is for general informational purposes only and should not be construed as financial advice. Investing in the stock market involves inherent risks, and there is no guarantee of profits or protection against losses. Before making any investment decisions, it is essential to conduct thorough research and seek advice from a qualified financial advisor or professional.
