Understanding Stock Volume
In the stock market, volume is one of the most essential concepts, representing the total number of shares or contracts traded for a particular security during a given period. For investors and traders, understanding volume is crucial as it provides insights into the momentum of trading, the strength of a trend, and potential reversals. Volume acts as a barometer, showing the level of interest and activity in a stock or the market as a whole.
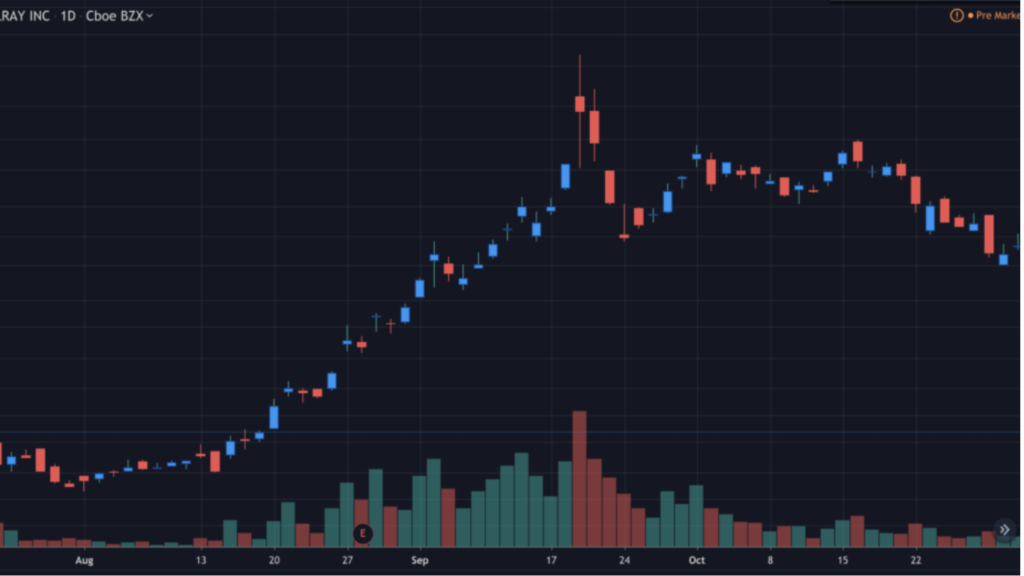
What Is Volume in stock market?
Stock Volume refers to the total quantity of shares or contracts traded within a specific timeframe, such as a day, hour, or minute.. It reflects how many times a stock or security was bought and sold during that period. High volume indicates active trading, often driven by significant news or events, while low volume may suggest a lack of interest or uncertainty among traders.
Volume is essential in analyzing the market’s behavior, as it helps determine the price action of a stock. For example, when a stock price rises on high volume, it usually signifies strong buying interest, which could mean the price trend will continue. On the other hand, when a stock price rises on low volume, it may indicate a lack of conviction among traders, and the trend could reverse.

Volume in Technical Analysis
In technical analysis, volume is a powerful tool used to confirm trends, identify reversals, and detect potential breakouts or breakdowns. Technical analysts rely on volume to gauge the strength or weakness of a price movement. For example, a strong upward trend accompanied by increasing volume suggests that the trend is likely to continue, while a decline in volume during an upward trend may indicate that the trend is losing strength.
Technical analysis often involves the study of chart patterns, candlestick patterns, and trend lines, all of which are more meaningful when analyzed with volume. For instance, a breakout from a resistance level on high volume is more likely to be sustained than a breakout on low volume. Similarly, a support level holding on high volume may indicate strong buying interest, making it less likely for the price to fall below that level.
Other Considerations
While volume is a critical indicator, it should not be used in isolation. Volume analysis is most effective when combined with other technical indicators such as moving averages, support and resistance levels, and volume indicators. By using multiple indicators, traders can gain a more comprehensive view of the market and make better-informed decisions.
Volume analysis is also essential for understanding the market sentiment. For example, during periods of market uncertainty or market risk, volume can spike as investors rush to buy or sell, reflecting their emotions and market outlook.

What Does Volume Mean in Stock?
Volume serves as a measure of the market’s interest in a particular stock. High volume often indicates that a stock is in demand, possibly due to positive news, strong earnings, or other factors that attract investors. Conversely, low volume might suggest that a stock is not garnering much attention, possibly due to a lack of news, poor performance, or market indifference.
When analyzing volume, it’s essential to consider the context. A sudden increase in volume can be a sign of a significant event or a shift in market sentiment. For example, if a stock that typically trades on low volume suddenly experiences a surge in trading activity, it may indicate that something substantial has changed, prompting investors to take action.

What Is a Good Volume for a Stock?
The concept of a “good” volume for a stock varies depending on the specific security and the market it trades in. Generally, higher volume is preferable because it indicates higher liquidity, meaning that the stock can be bought or sold easily without causing significant price changes. High liquidity is especially important for scalping and day trading, where quick entry and exit from trades are crucial.
For large-cap stocks, a good volume might be in the millions of shares traded per day, whereas for small-cap stocks, a few hundred thousand shares might be considered good volume. Traders often look at the average daily volume to determine if a stock has sufficient liquidity for their trading strategies.

How Much Is 1 Volume in Stocks?
In the context of the stock market, 1 volume refers to one share traded. For example, if a stock has a trading volume of 1 million, it means that 1 million shares have been traded during the specified period. This metric helps traders and investors understand the level of activity and liquidity in a stock.
How to Use Stock Volume to Improve Your Trading
Understanding how to use volume in your trading strategy can significantly improve your decision-making process. Here’s how you can leverage volume to enhance your trading:

Basic Guidelines for Using Volume
- Trend Confirmation: Volume is a critical factor in confirming trends. If a price trend is accompanied by increasing volume, it suggests that the trend has strong momentum and is likely to continue. Conversely, if volume decreases during a trend, it might signal that the trend is weakening and could reverse.
- Exhaustion Moves and Volume: An exhaustion move occurs when a stock makes a significant price move on high volume, often indicating the end of a trend. For example, if a stock has been in an uptrend and suddenly experiences a sharp rise in price on extremely high volume, it may suggest that the uptrend is exhausting, and a reversal could be imminent.
- Bullish Signs: In the context of bullish signals, rising volume during an upward price move is often seen as a positive sign. It indicates strong buying interest and suggests that the price may continue to rise.

- Volume and Price Reversals: Volume can also signal potential price reversals. A reversal occurs when the price changes direction after a sustained trend. If a stock has been in a downtrend and suddenly reverses on high volume, it could indicate the start of a new uptrend.
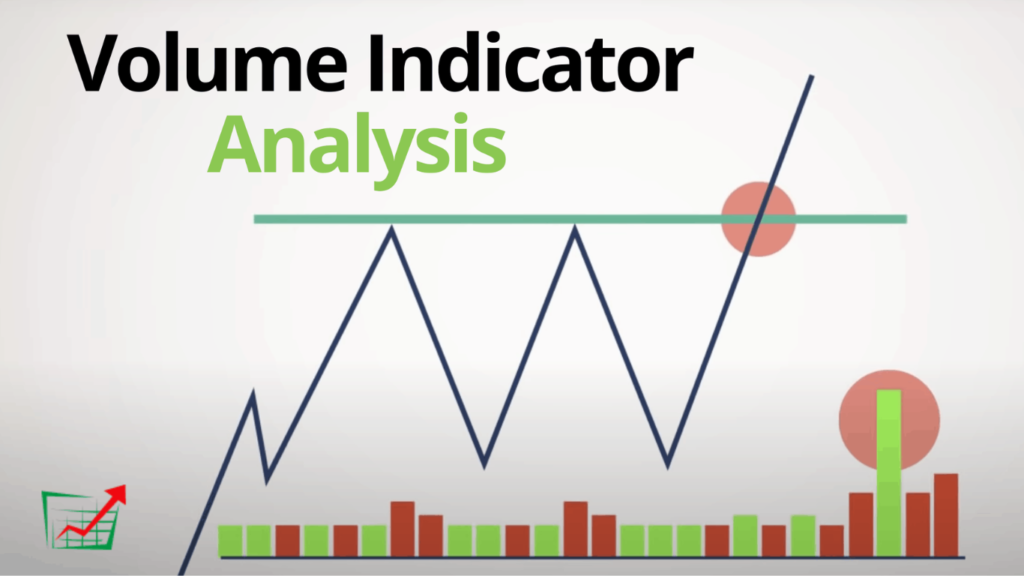
- Volume and Breakouts vs. False Breakouts: One of the most common uses of volume is in identifying breakouts and avoiding false breakouts. A breakout occurs when the price moves above a resistance level or below a support level. A breakout accompanied by high volume is more likely to be genuine and sustained, while a breakout on low volume is often a false signal.
- Volume History: Analyzing a stock’s volume history can provide valuable insights. By comparing current volume levels with historical averages, traders can determine if the current trading activity is unusual and whether it warrants further investigation.
Three Volume Indicators
Volume indicators are technical analysis tools that use volume data to provide trading signals. Here are three popular volume indicators:
- On-Balance Volume (OBV): OBV is a cumulative indicator that adds volume on up days and subtracts it on down days. It helps traders assess buying and selling pressure, making it useful for confirming trends and predicting potential reversals.
- Chaikin Money Flow: The Chaikin Money Flow indicator combines price and volume to determine whether a stock is being accumulated (bought) or distributed (sold). Positive values indicate buying pressure, while negative values suggest selling pressure.
- Klinger Oscillator: The Klinger Oscillator measures the long-term trend of money flow while detecting short-term fluctuations. It is particularly useful for identifying potential reversals and confirming the strength of a trend.
What Is the Most Common Time Frame for Measuring Volume in Stocks?
The daily timeframe is the most common period for measuring volume in stocks. Daily volume provides a clear picture of how actively a stock is being traded over a single trading session, making it a vital tool for both day traders and long-term investors. However, shorter timeframes, such as hourly or minute-by-minute, can also be used for more granular analysis, especially in scalping and day trading strategies.
What Are Some Popular Volume Indicators?
In addition to the three-volume indicators mentioned earlier, several other popular volume indicators can help traders make informed decisions:
- Volume Price Trend (VPT): This indicator combines price and volume to determine the strength of price movements. It helps traders assess whether a price trend is supported by sufficient volume.
- Accumulation/Distribution Line: The Accumulation/Distribution Line measures the cumulative flow of money into and out of a stock, providing insights into whether a stock is being accumulated or distributed.
- Money Flow Index (MFI): The MFI is a momentum indicator that uses price and volume to identify overbought or oversold conditions. It is particularly useful in detecting potential reversals.

What Trading Signals Can Be Provided by Volume?
Volume provides several key trading signals that can help traders make better decisions:
- Breakout Signals: High volume during a breakout confirms that the price move is genuine and likely to continue. This signal is essential for identifying potential entry points.
- Reversal Signals: A sharp price reversal accompanied by high volume often indicates a significant shift in market sentiment, signaling a change in trend.
- Continuation Signals: Consistent volume in the direction of the trend suggests that the trend is strong and likely to continue. This signal can help traders stay in profitable trades longer.

In the case of a Pullback, How Can Volume Be Interpreted?
During a pullback, volume can provide valuable insights into the strength and sustainability of the trend:
- Low Volume Pullbacks: If a pullback occurs on low volume, it might indicate that the pullback is temporary and the trend will likely resume. This scenario is often seen as a buying opportunity in a strong uptrend.
- High-Volume Pullbacks: A pullback on high volume could signal a potential reversal, especially if it follows a strong trend. Traders should be cautious in such situations, as the high volume suggests that the pullback may be more than just a temporary pause.

The Bottom Line
Volume is a critical tool in the stock market, offering insights into market sentiment, trend strength, and potential reversals. By incorporating volume analysis into their trading strategies, investors can make more informed decisions and improve their chances of success. The Millionaires Group emphasizes the importance of using volume in conjunction with other technical analysis tools, such as support and resistance levels, moving averages, and candlestick patterns, to develop a well-rounded trading strategy. Whether you are a beginner or an experienced trader, mastering the use of volume can provide a significant edge in the competitive world of trading.
FOR A FREE STOCK MARKET SEMINAR VISIT HERE
CALLS @ 9986622277
Disclaimer
The information provided here is for general informational purposes only and should not be construed as financial advice. Investing in the stock market involves inherent risks, and there is no guarantee of profits or protection against losses. Before making any investment decisions, it is essential to conduct thorough research and seek advice from a qualified financial advisor or professional.
